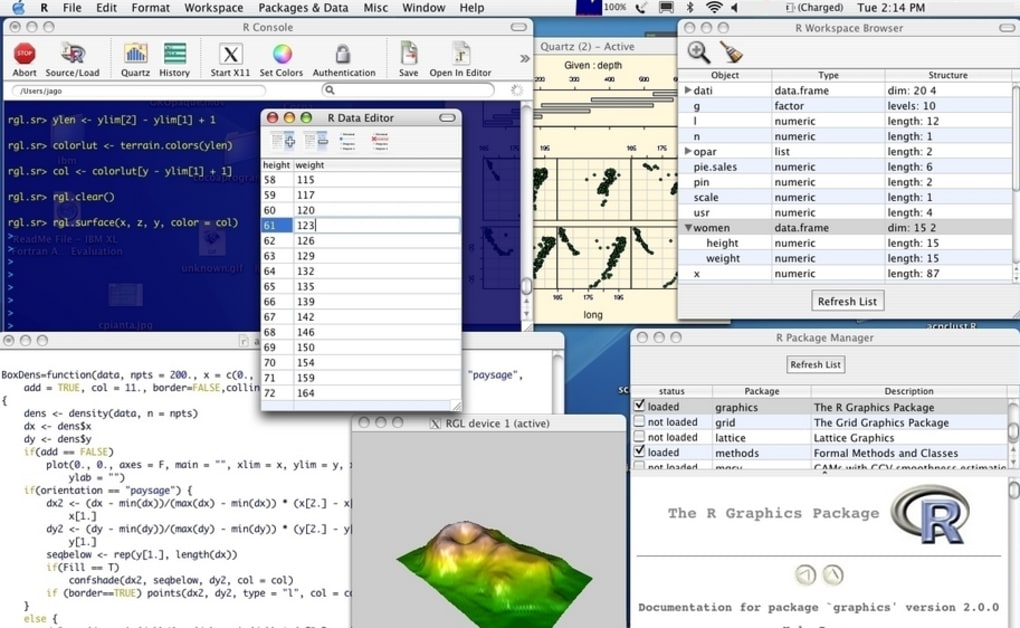

Download R Project – free statistical analysis software for biochemistry
Overview
R Project is a powerful, open‑source statistical computing environment that has become the de‑facto standard for biochemistry students, biomedical researchers, and seasoned scientists who need to perform sophisticated linear and non‑linear calculations. Built on the S language, R offers a rich ecosystem of packages that support everything from classical hypothesis testing and time‑series analysis to advanced classification, clustering, and high‑resolution graphical output. Because the software is freely downloadable, it eliminates licensing costs while providing a professional‑grade analytical tool that can handle the most demanding data‑intensive projects in the life sciences.
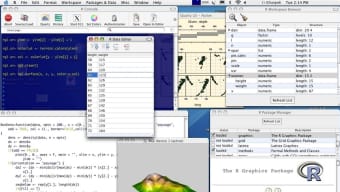
R’s strength lies in its ability to generate publication‑ready plots that incorporate mathematical symbols, formulae, and custom themes, making it an ideal companion for journal articles, conference posters, and grant proposals. While the learning curve can be steep for newcomers, those who invest the time to master its syntax and package ecosystem unlock a level of flexibility and reproducibility that proprietary alternatives simply cannot match. The open‑source nature also means users can modify the source code, contribute new packages, or tailor existing functions to meet the exact needs of a research project.
In short, R Project is a secure, continuously updated tool that puts complete statistical control in the hands of the user—provided the user has the expertise to wield it responsibly.
Key Features & Capabilities
- Extensive statistical library: Over 18,000 packages on CRAN cover linear and non‑linear modeling, survival analysis, Bayesian inference, and more.
- High‑quality graphics: The
ggplot2system and base graphics produce publication‑ready figures with precise control over axes, legends, and mathematical annotations. - Reproducible workflows: Integration with R Markdown and Sweave enables dynamic report generation, ensuring that analyses can be rerun and audited.
- Cross‑platform compatibility: Native support for Windows, macOS, and Linux, with seamless installation via installers or package managers.
- Open‑source flexibility: Users can inspect, modify, and extend the source code, fostering a collaborative environment for method development.
- Data import/export: Built‑in functions for reading CSV, Excel, SAS, SPSS, and JSON files, plus connectivity to databases via
DBIandodbc. - Advanced machine‑learning tools: Packages like
caret,randomForest, andkerasbring state‑of‑the‑art algorithms to biochemists without requiring a separate platform. - Time‑series and signal processing: Modules such as
forecastandsignalsupport spectral analysis, smoothing, and ARIMA modeling for kinetic data. - Community support: An active global community contributes tutorials, Stack Overflow answers, and dedicated biochemistry forums.
These features collectively make R Project a versatile research companion. Whether you are fitting a Michaelis‑Menten curve, performing multivariate PCA on metabolomics data, or visualizing protein‑interaction networks, R provides the computational backbone needed to derive insight from complex datasets. The modular architecture ensures that new methods can be integrated as they emerge, keeping your analytical pipeline current without expensive software upgrades.
Installation, Usage & Compatibility
Step‑by‑Step Installation
Downloading and installing R Project is straightforward:
- Visit the official CRAN mirror at cran.r‑project.org.
- Select the installer for your operating system (Windows, macOS, or Linux).
- Run the downloaded executable (Windows) or
.pkgfile (macOS) and follow the on‑screen prompts. Linux users can install via their package manager, e.g.,sudo apt-get install r-basefor Debian‑based distributions. - After the core installation, launch the R console or an IDE such as RStudio for a more user‑friendly interface.
- Install additional packages using
install.packages("packageName")or the built‑in package manager in RStudio.
Basic Usage Workflow
Once installed, a typical workflow for a biochemistry project might look like this:
- Data import: Use
read.csv()orreadxl::read_excel()to bring raw assay results into R. - Data cleaning: Apply
dplyrverbs (filter(),mutate(),group_by()) to reshape and normalize measurements. - Statistical modeling: Fit a non‑linear regression with
nls()for enzyme kinetics or a mixed‑effects model vialme4::lmer()for repeated‑measure experiments. - Visualization: Generate a scatter plot with error bars using
ggplot2, adding a fitted curve and confidence interval. - Reporting: Compile the analysis into an R Markdown document that renders to HTML, PDF, or Word, embedding code, results, and graphics automatically.
Operating System Compatibility
R Project runs natively on Windows 10/11 (64‑bit), macOS 10.15+ (Catalina and later), and all major Linux distributions (Ubuntu, Fedora, Debian, openSUSE). The software requires a minimum of 2 GB RAM for basic tasks, though complex simulations or large omics datasets benefit from 8 GB or more. R’s command‑line interface works well on servers, allowing batch processing via Rscript or integration with high‑performance computing clusters through SLURM or PBS.
Because R is open source, community‑maintained binaries are frequently updated, ensuring security patches and new features are delivered promptly. Users can also install the “RTools” suite on Windows for compiling packages from source, enhancing compatibility with the latest statistical methods.
Pros, Cons & Frequently Asked Questions
Pros
- Completely free and open‑source – no licensing fees.
- Vast ecosystem of packages tailored to biochemistry and biomedical research.
- High‑resolution, customizable graphics suitable for journal publication.
- Strong reproducibility tools (R Markdown, version control integration).
- Cross‑platform support ensures consistent results across Windows, macOS, and Linux.
Cons
- Steep learning curve for users unfamiliar with programming.
- Command‑line interface can be intimidating without an IDE.
- Memory management may require careful handling for extremely large datasets.
- Some specialized commercial bioinformatics tools offer point‑and‑click GUIs that are more approachable for beginners.
FAQ
Is R Project suitable for absolute beginners in biochemistry?
R is primarily designed for users with at least a basic understanding of statistics and programming. Beginners may find the learning curve steep, but introductory courses, online tutorials, and the RStudio IDE make the transition manageable.
Can I use R for real‑time data acquisition from laboratory instruments?
Yes. Packages such as Rserve and serial allow R to communicate with hardware over TCP/IP, USB, or serial ports, enabling real‑time data capture and immediate statistical analysis.
How secure is the R software download?
Downloading from the official CRAN mirror guarantees a verified, cryptographically signed package. Regular security updates are released, and the open‑source nature allows the community to audit the code for vulnerabilities.
What is the best IDE for R in a biochemistry workflow?
RStudio is the most widely adopted IDE. It provides syntax highlighting, integrated package management, version control, and a built‑in viewer for plots, making it ideal for complex analytical pipelines.
Can I integrate R with other bioinformatics tools like Python or MATLAB?
Absolutely. The reticulate package enables seamless calling of Python code from within R, while the R.matlab package facilitates data exchange with MATLAB, supporting hybrid workflows.
Conclusion & Call to Action
R Project stands out as the most flexible, cost‑effective, and academically robust statistical platform for biochemistry students and professional scientists alike. Its extensive library of packages, superior graphics engine, and commitment to reproducibility make it the go‑to choice for anyone who needs to perform rigorous linear or non‑linear modeling, time‑series analysis, or advanced machine‑learning tasks on biochemical data. While the initial learning curve can be daunting, the payoff in analytical power, customizability, and community support is unmatched. For researchers ready to elevate their data‑analysis workflow, the best next step is to download the latest version from the official CRAN site, install RStudio for a user‑friendly interface, and begin exploring the wealth of tutorials tailored to life‑science applications.
Ready to start? Download R Project now and join the global community of scientists who trust R for high‑impact research.
Pros: Free, extensive packages, high‑quality graphics, cross‑platform, reproducible workflows.
Cons: Steep learning curve, command‑line reliance, memory considerations for massive datasets.